Core Platform
Making an invisible data routing layer legible
Problem
Segment was the bridge between the tools where customer data originated and the tools that used it. It ran as a routing layer, moving data across a sprawling ecosystem of tools, but the mechanism itself was hard to see or reason about. The opacity came from two things. First, the product’s language was anchored in Segment’s own engineering view, the connectors it had built, rather than the customer’s reality, so people had to translate their own setup into a framework that wasn’t theirs. Second, the middle was a black box. Customers could see the endpoints, which sources were emitting events and which tools were consuming them, but not how data moved between them. They had no holistic view of the system, and no way to trace which sources were feeding a given destination. For a system built to make data usable, the underlying logic was more obscured than it needed to be.
Role & scope
I was the sole designer on two initiatives: first, to address customer confusion around the integrations language, I ran the research and recommended a clearer vocabulary. Later, on a small team with the founder and the Head of Product Marketing, I designed the visualization that became the platform’s core view. Throughout, I grounded the work in how users actually reasoned about their data.
Approach
Resolving the language
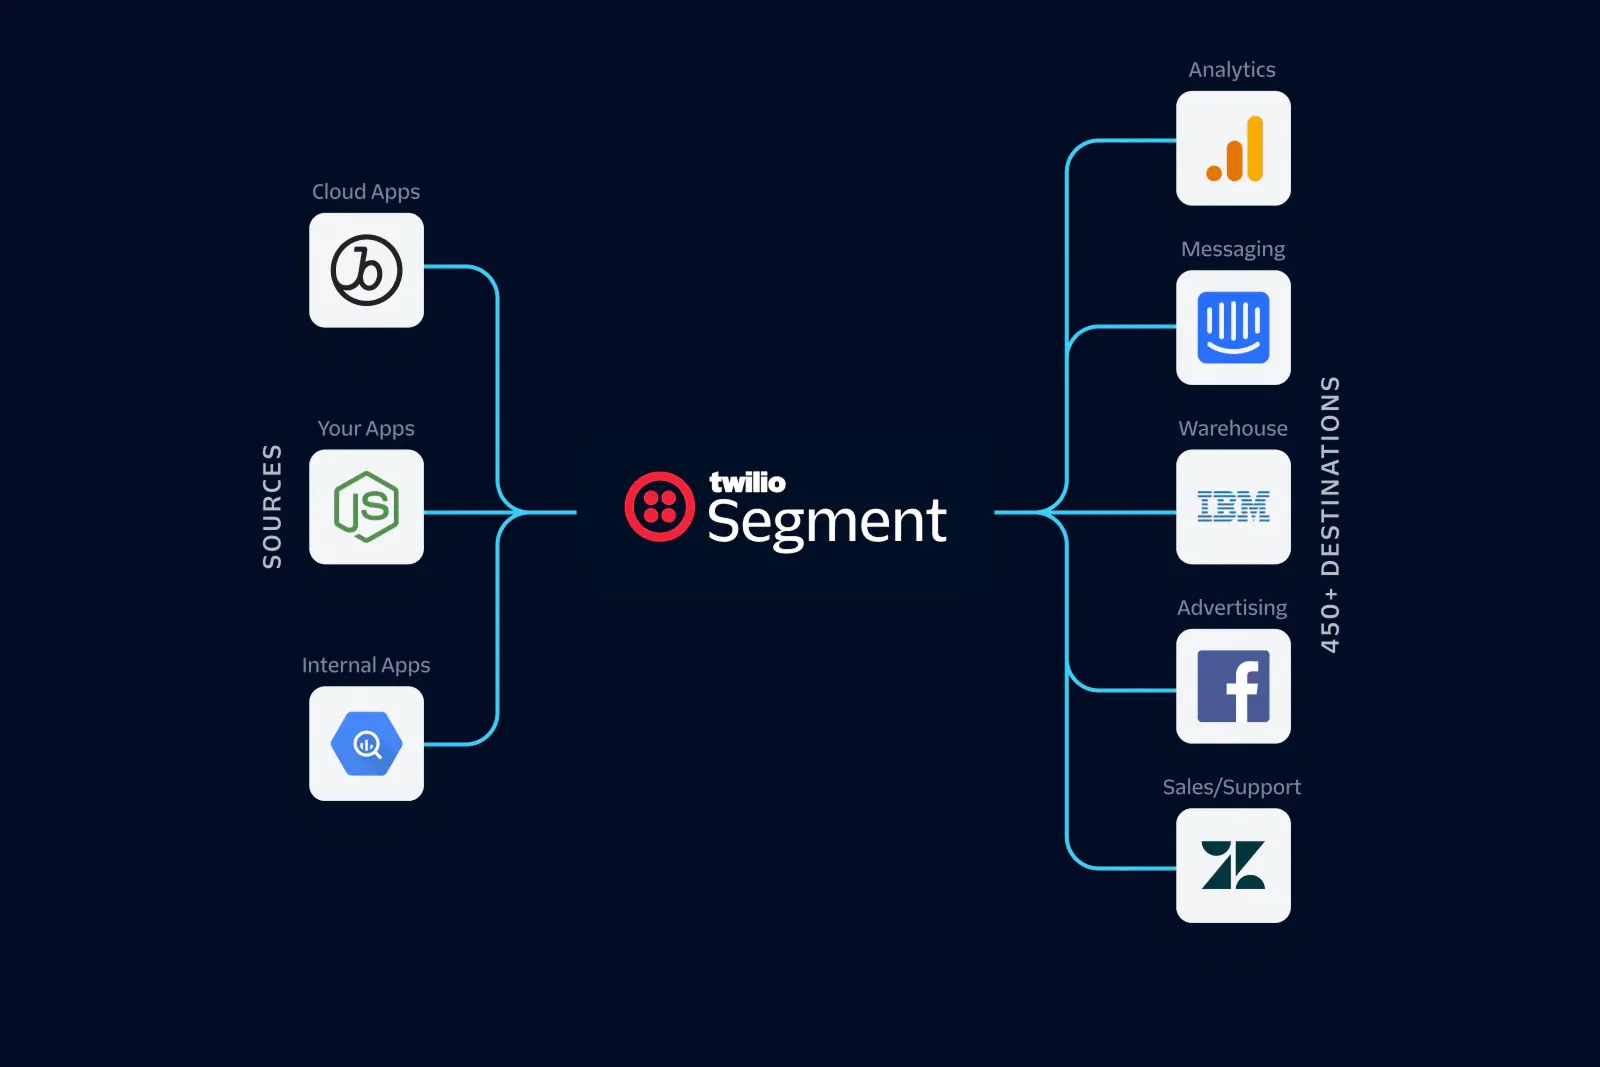
Through customer research, I surfaced a problem the existing vocabulary was quietly creating. People thought of Segment itself as an integration, so when we labeled endpoints connecting downstream third-party services "integrations," the term collided with what customers already believed Segment was. The diagnosis led me to recommend a customer-centric vocabulary. Data comes from sources (first-party data from customer-owned surfaces) and flows through Segment to destinations (inclusive of both third-party applications and data warehouses). This reframed the product nomenclature around how customers actually reasoned about their data.
Making the flow visible
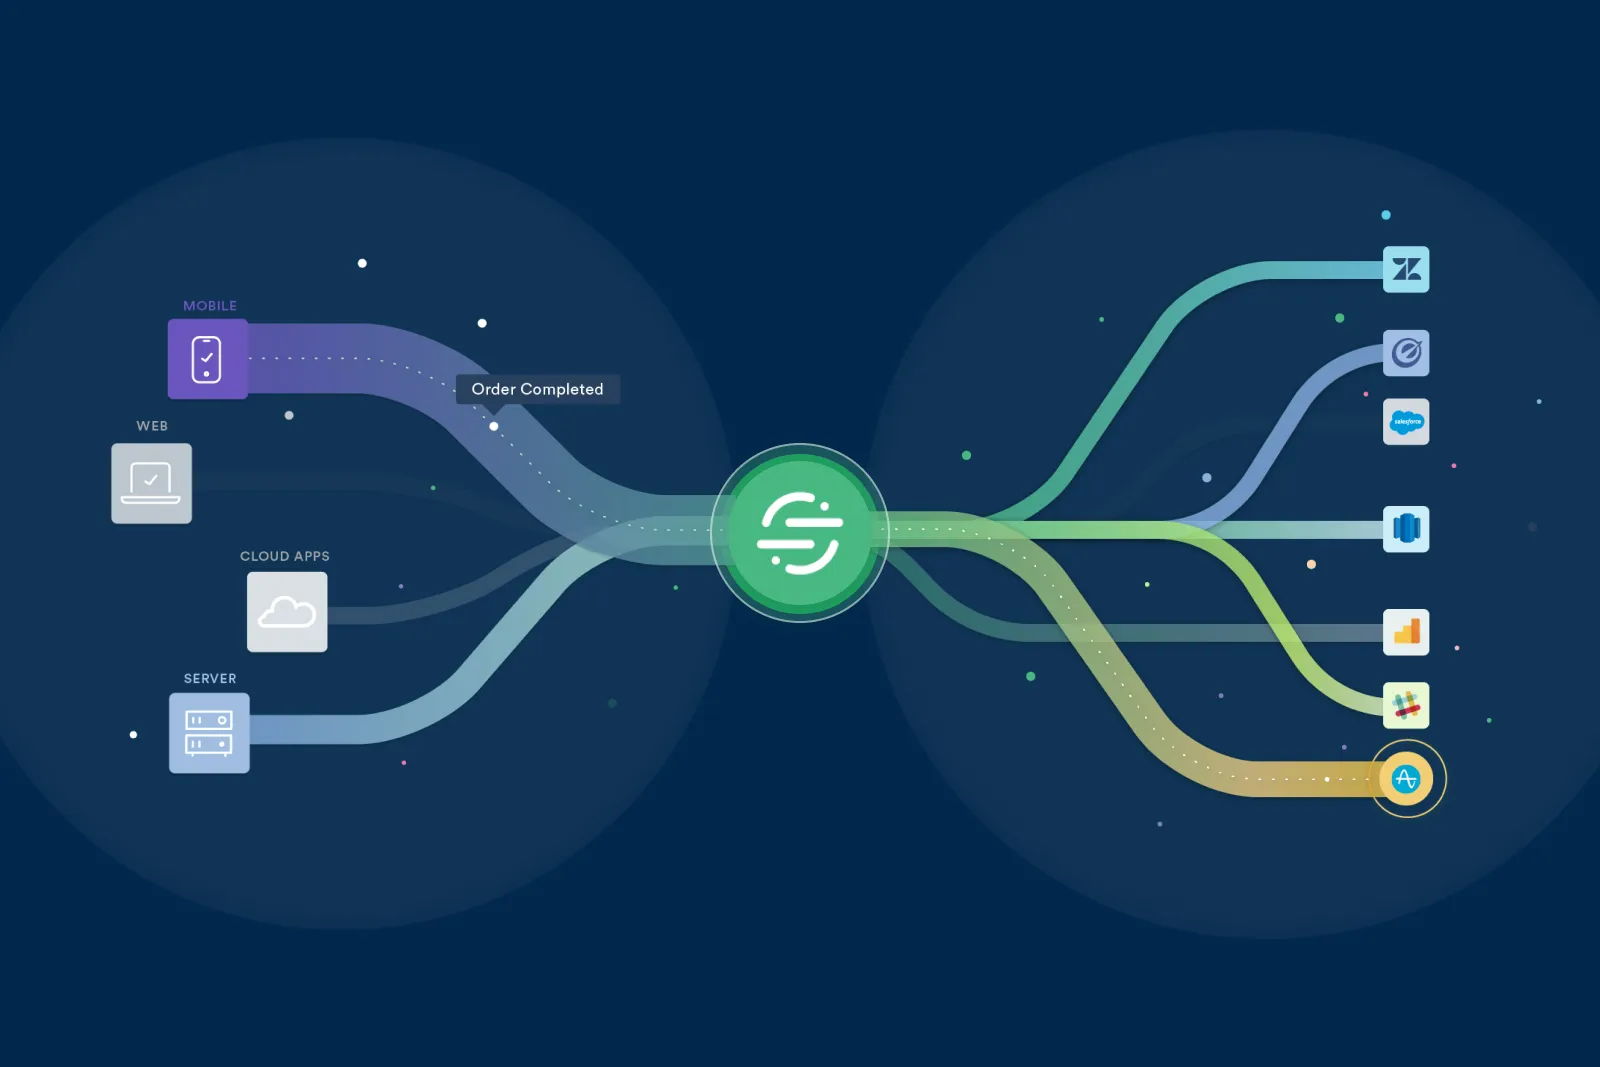
The new vocabulary resolved the ambiguity around "integrations" but not how sources and destinations actually connected: customers still had no easy way to see how their data moved, either across the system as a whole or along any single route. I joined a small team with the founder and the Head of Product Marketing to solve it in the web app. The founder proposed restructuring the entire web app into three horizontally scrolling pages. I appreciated the vision but was concerned about building the product around such a non-standard interaction pattern. Inspired by Sankey diagrams, I proposed a more bounded visualization for the Overview: a view of connections between sources and destinations so the state of the system was visible at a glance.
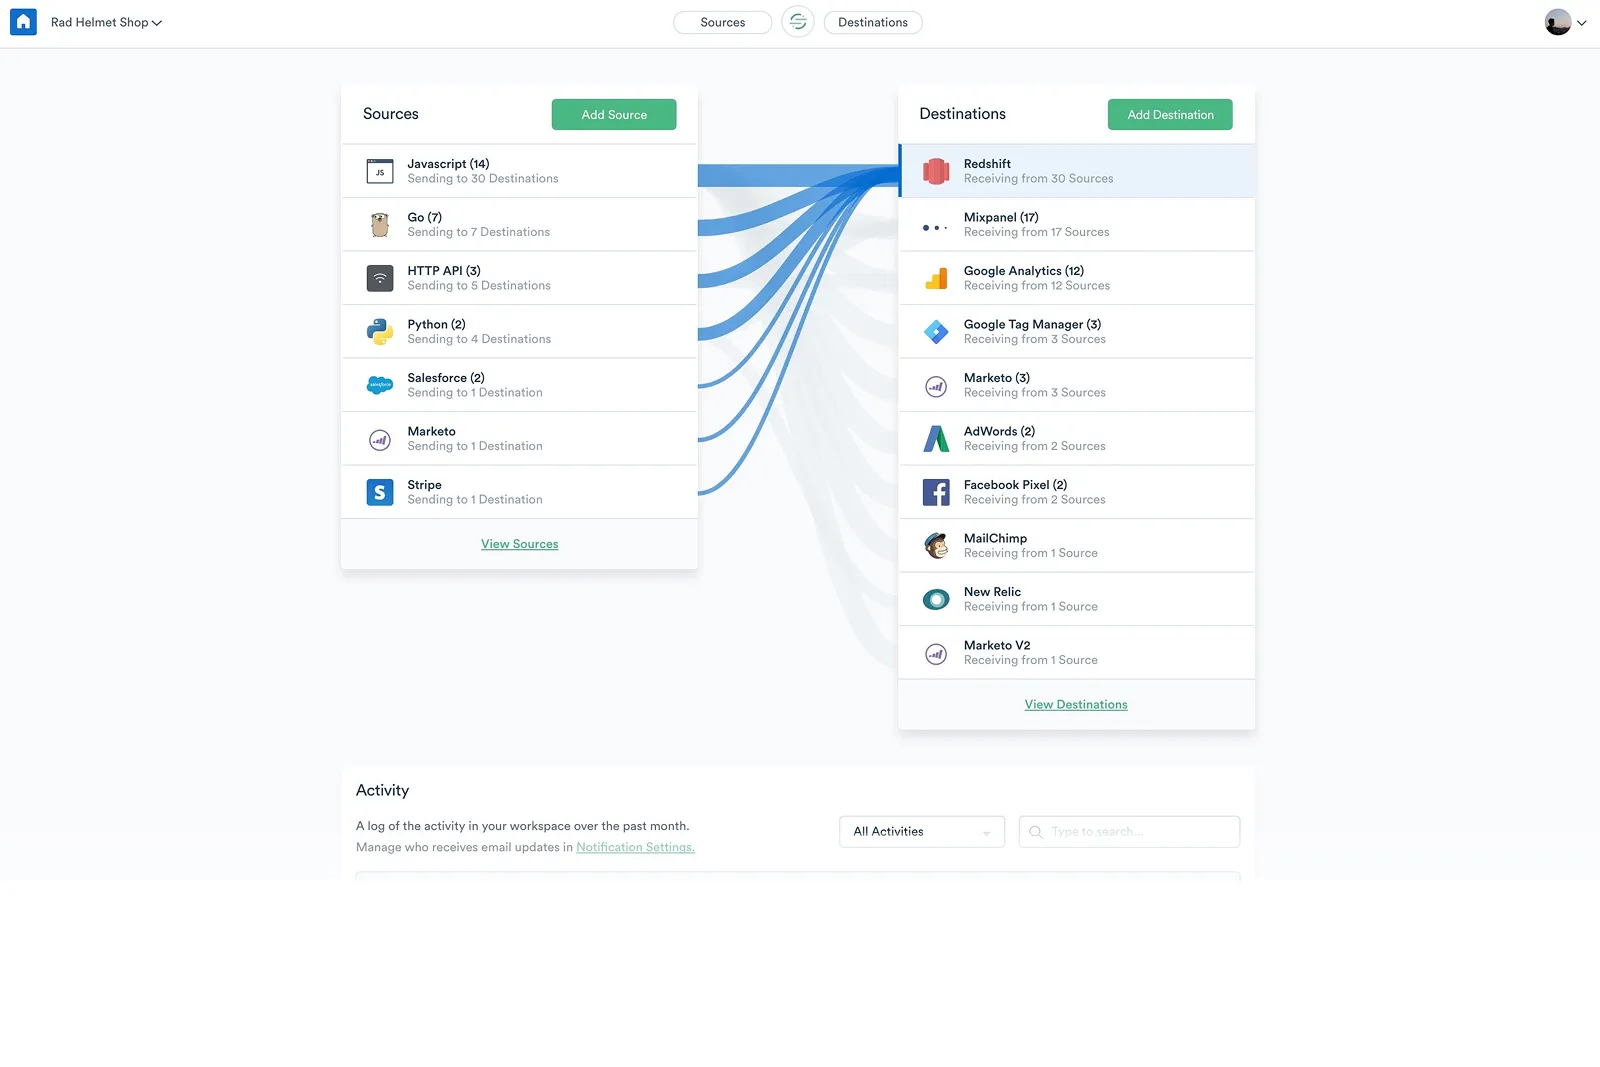
Shipping and refining
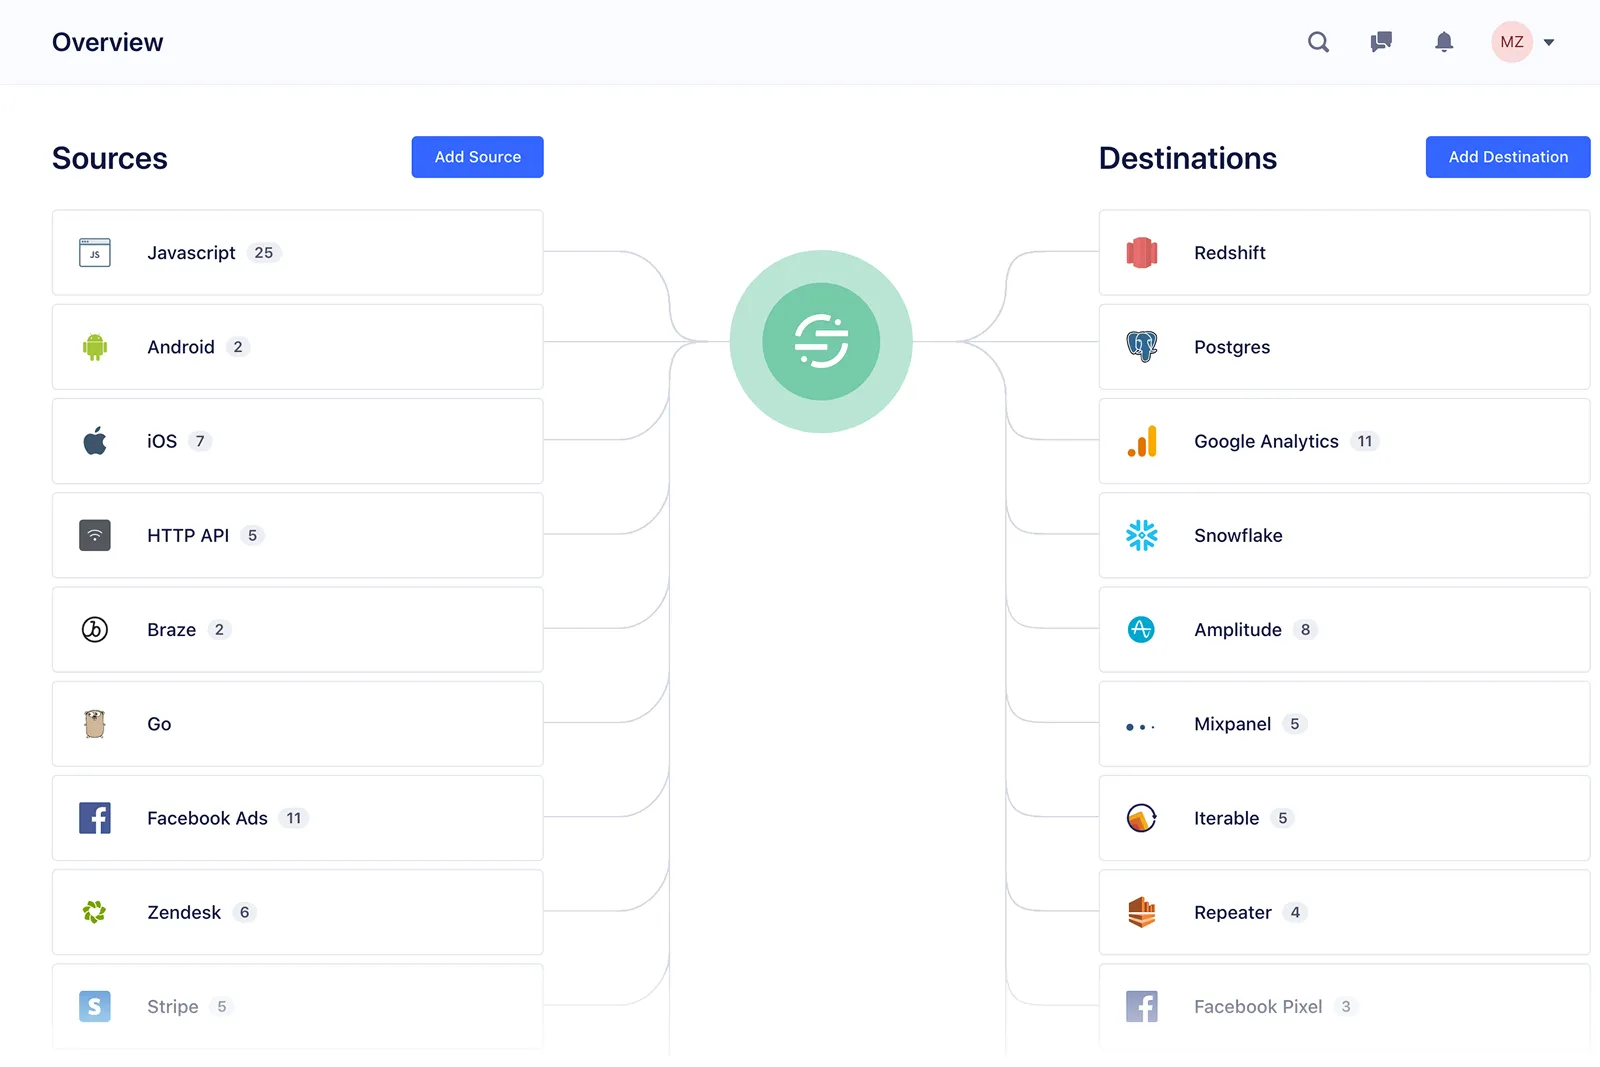
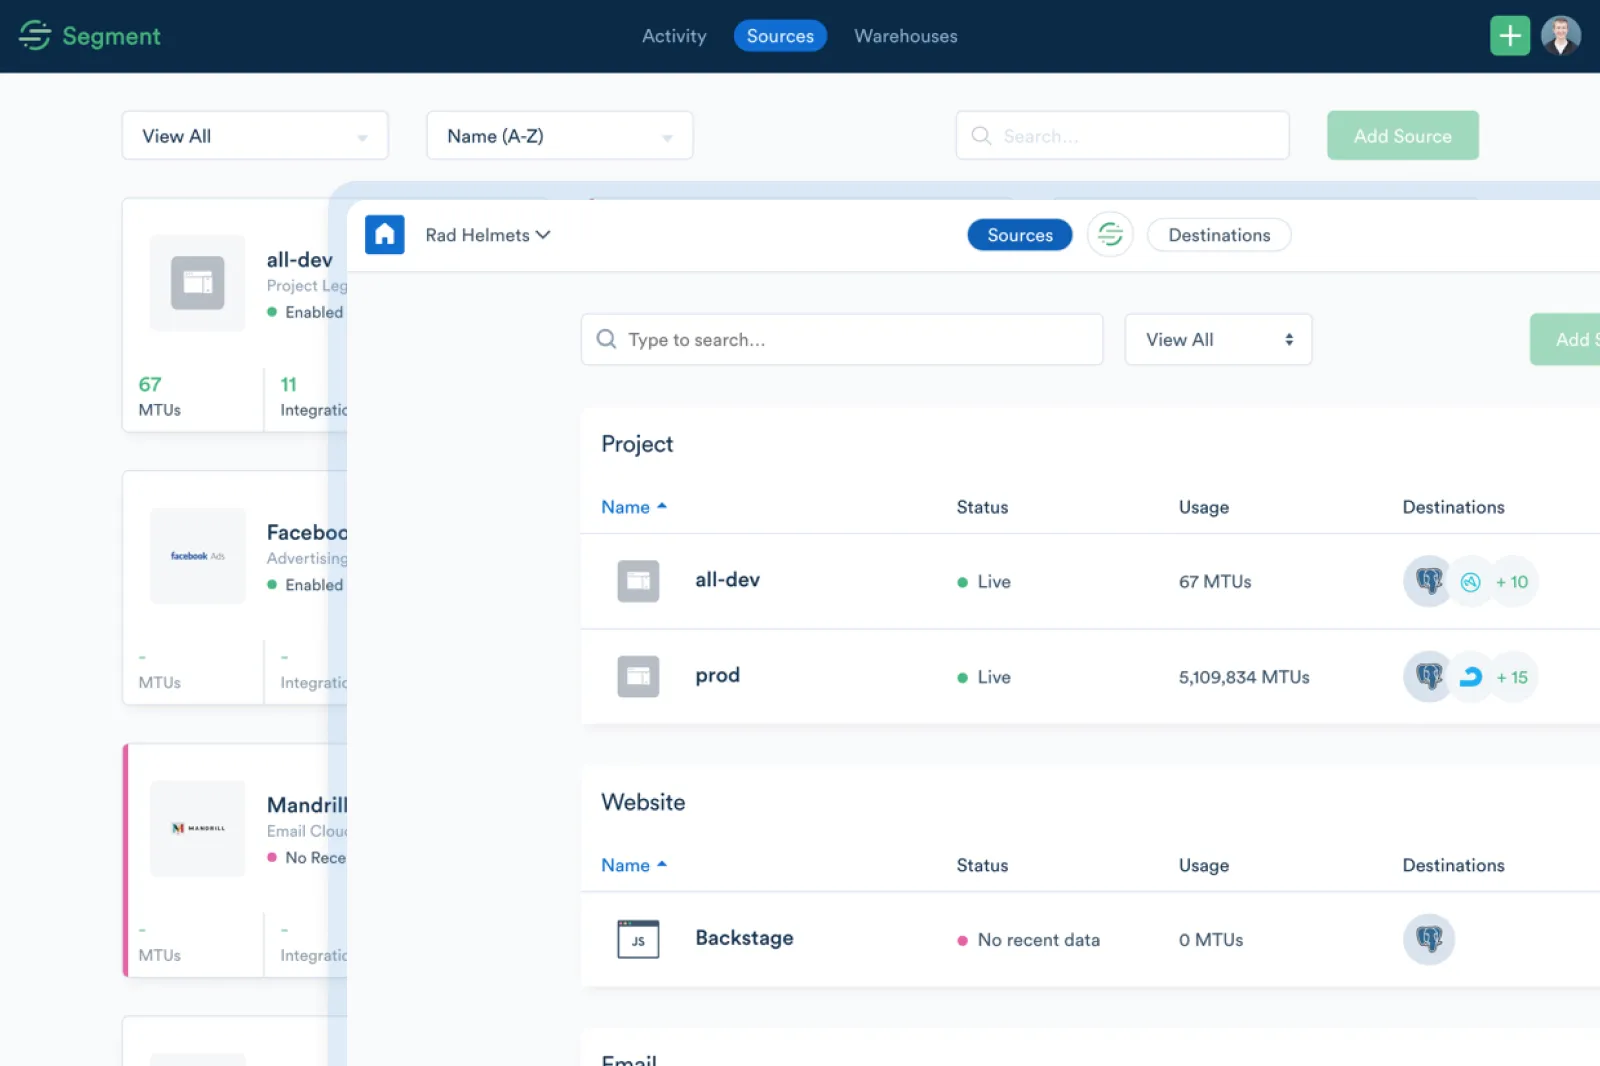
We shipped an MVP in about a week and refined it as real usage came in, tightening the visualization and building it into the Overview, the workspace homepage. The structure people saw every time they opened the product had become the central view.
Outcome
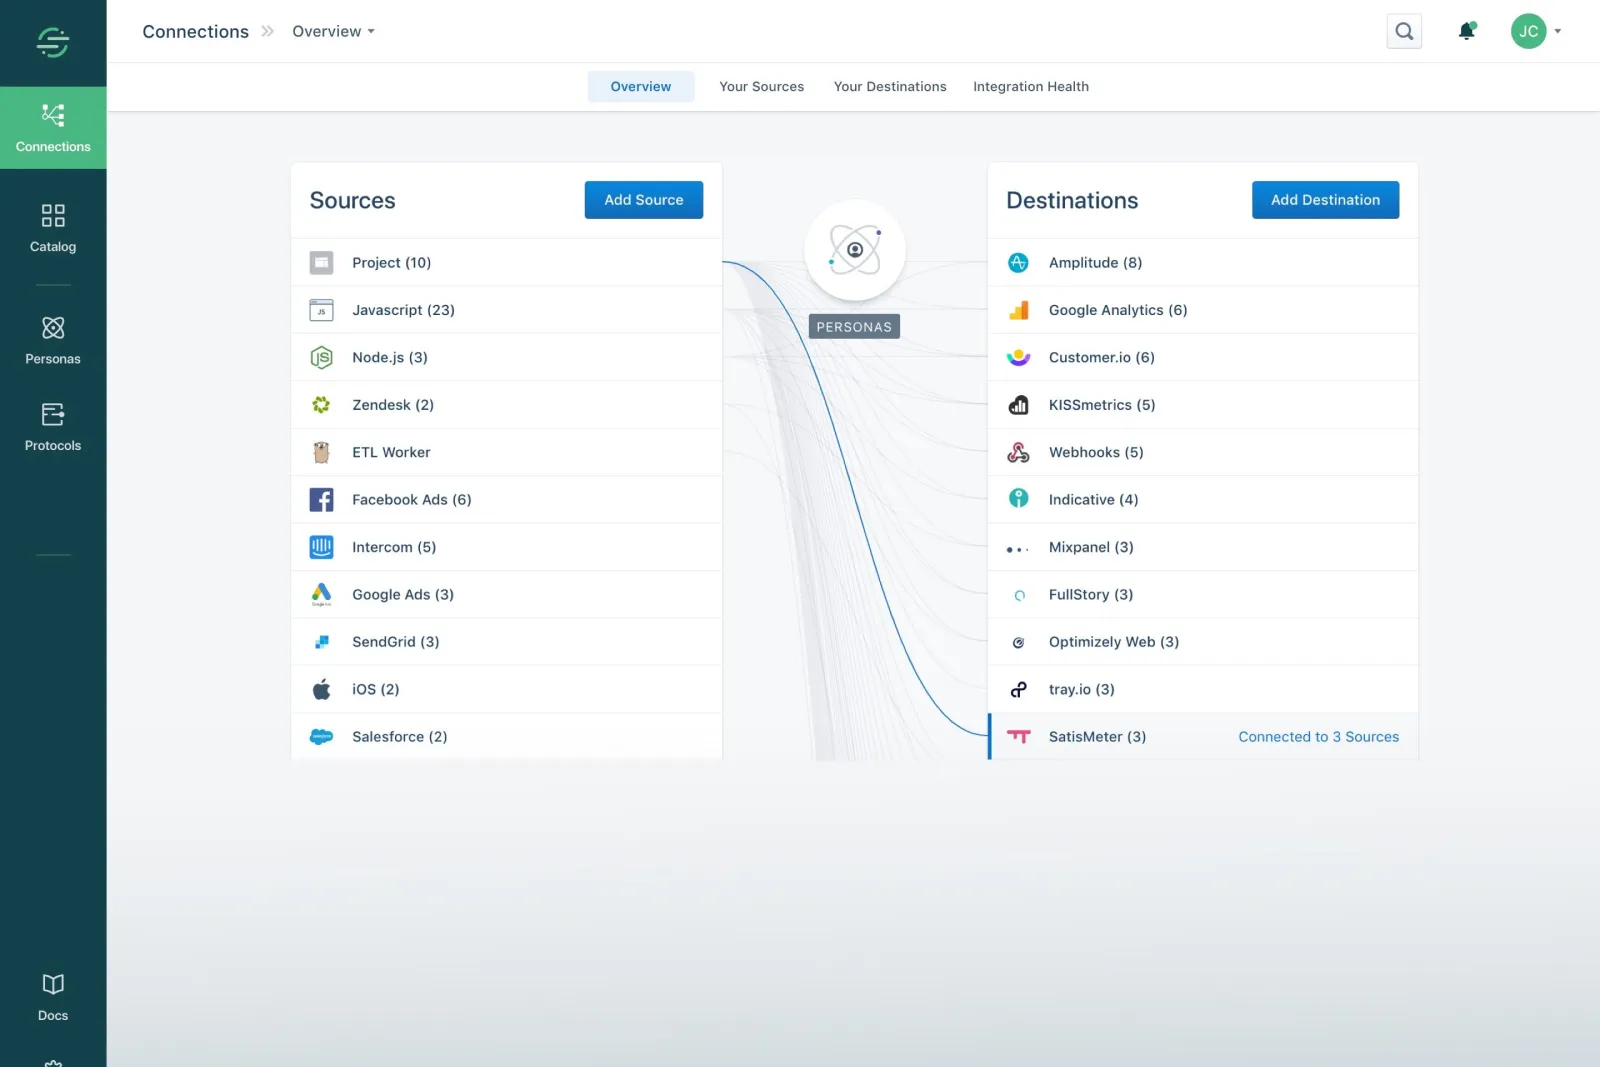
The work propagated outward in stages. The sources-and-destinations terminology first became the backbone of how the product itself was organized and understood. From there it shaped the Overview, the workspace homepage, where the directional flow of data between sources and destinations became the central visualization. The updated product experience was well received by customers, and the founders were pleased with the visualization as a succinct way to represent the core of the product.
The brand team then built on the same motif, and it came to anchor the marketing site and external collateral. Years later, through Segment’s acquisition by Twilio, the same language and motif still front the product and the brand, evidence that the model was durable enough to outlast reorganizations and a change in ownership. Both the vocabulary and the flow motif are common across universal API platforms today, though we landed on them generatively, without an obvious precedent at the time.